Until now, we have examined sets using set notation. We know from previous lessons that the following conventions are used with sets:
- Capital letters are used to denote sets.
- Lowercase letters are used to denote elements of sets.
- Curly braces { } denote a list of elements in a set.
Another way to look at sets is with a visual tool called a Venn diagram, first developed by John Venn in the 1880s. In a Venn diagram, sets are represented by shapes; usually circles or ovals. The elements of a set are labeled within the circle. Let's look at some examples.
Example 1: Given set R is the set of counting numbers less than 7. Draw and label a Venn diagram to represent set R and indicate all elements in the set.
Analysis: Draw a circle or oval. Label it R. Put the elements in R.
Solution:
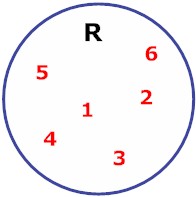
Notation: R = {counting numbers < 7}
Example 2: Given set G is the set of primary colors. Draw and label a Venn diagram to represent set G and indicate all elements in the set.
Analysis: Draw a circle or oval. Label it G. Put the elements in G.
Solution:
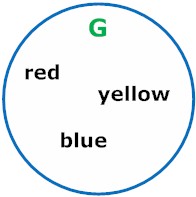
Notation: G = {primary colors}
Example 3: Given set B is the set of all vowels in the English alphabet. Draw and label a Venn diagram to represent set B and indicate all elements in the set.
Analysis: Draw a circle or oval. Label it B. Put the elements in B.
Solution:
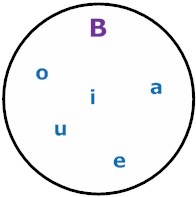
Notation: B = {vowels}
In each example above, we used a Venn diagram to represent a given set pictorially. Venn diagrams are especially useful for showing relationships between sets, as we will see in the examples below. First, we will use a Venn diagram to find the intersection of two sets. The intersection of two sets is all the elements they have in common.
Example 4: Let X = {1, 2, 3} and Let Y = {3, 4, 5}. Draw and label a Venn diagram to show the intersection of sets X and Y.
Analysis: We need to find the elements that are common in both sets. Draw a picture of two overlapping circles. Elements that are common to both sets will be placed in the middle part, where the circles overlap.
Solution:
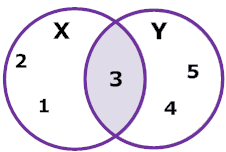
Explanation: The circle on the left represents set X and the circle on the right represents set Y. The shaded section in the middle is what they have in common. That is their intersection.
The Venn Diagram in example 4 makes it easy to see that the number 3 is common to both sets. So the intersection of X and Y is 3. This is what X and Y have in common. The intersection of X and Y is written as  and is read as "X intersect Y". So Intersection means "X and Y". In example 5 below, we will find the union of two sets. The union of two sets is the set obtained by combining the elements of each.
Example 5: Let X = {1, 2, 3} and Let Y = {3, 4, 5}. Draw and label a Venn diagram to represent the union of these two sets.
Analysis: To find the union of two sets, we look at all the elements in the two sets together.
Solution:
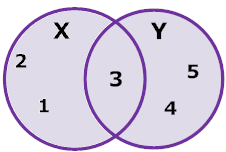
Explanation: Any element in X, Y, or in their intersection is in their union. So X union Y is {1, 2, 3, 4, 5}. Both circles have been shaded to show the union of these sets.
The union of two sets is written as  and is read as "X union Y". It means "X or Y". Let's compare intersection and union.
| Intersection | Union | |
| written as |  |
 |
| read as | X intersect Y | X union Y |
| meaning of | X and Y | X or Y |
| Look for the | elements in common to both | combine all elements |
The examples in this lesson included simple Venn diagrams. We will explore this topic in more depth in the next few lessons. We will also learn more about intersection and union in this unit.
Summary: We can use Venn diagrams to represent sets pictorially. Venn diagrams are especially useful for showing relationships between sets, such as the intersection and union of overlapping sets.
Exercises
Directions: Read each question below. Select your answer by clicking on its button. Feedback to your answer is provided in the RESULTS BOX. If you make a mistake, rethink your answer, then choose a different button.
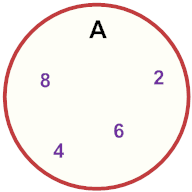
| 1. | Which of the following is represented by the Venn diagram below?
|
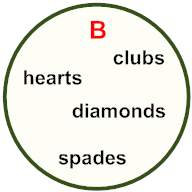
| 2. | Which of the following is represented by the Venn diagram below?
|
| 3. | Which of the following is represented by the Venn diagram below?
|
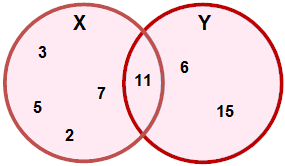
| 4. | Which of the following is the correct roster notation for set X?
|
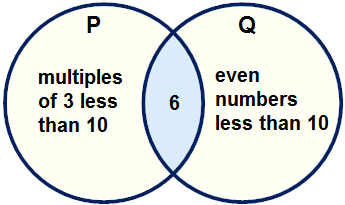
| 5. | Which of the following relationships is shown by the Venn diagram below?
|


