


In the last lesson, we learned that a bar graph is useful for comparing facts. The bars provide a visual display for comparing quantities in different categories. Bar graphs can have horizontal or vertical bars. In this lesson, we will show you the steps for constructing a bar graph.
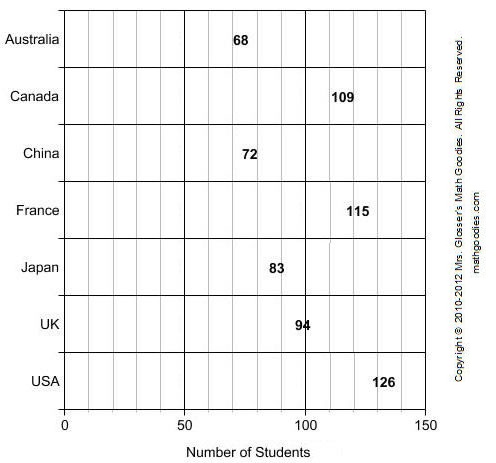
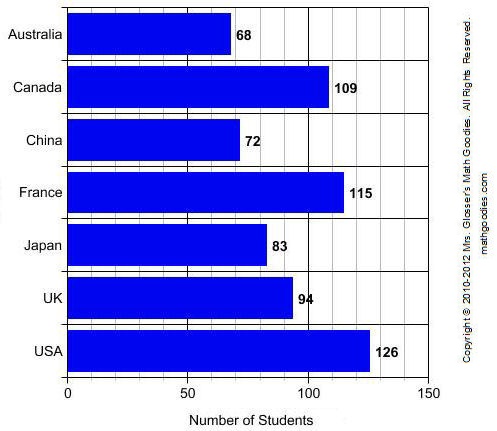
Example 1: The table below shows the number of students from various countries who attend an international school. Construct a bar graph to visually display this data.
| International Students By Country | |
| Country | Number of Students |
| Australia | 68 |
| Canada | 109 |
| China | 72 |
| France | 115 |
| Japan | 83 |
| UK | 94 |
| USA | 126 |
Step 1: Find the range in values.
What units are used? What is the greatest value? What is the least value?
The units are number of students. The greatest value is 126 and the least value is 68.
Step 2: Determine a scale.
Using graph paper, start with 1 box = 1 unit. What is the length (or height) of the longest bar? Will it fit? If not, change the scale and try again.
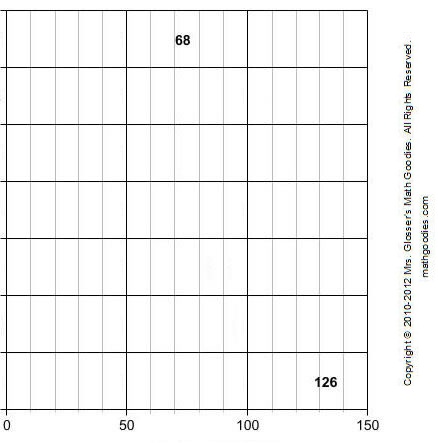
The scale must start at 0. So the horizontal scale will range from 0 to 150.
Step 3: Label the graph.
Mark each rectangle along the scale. Label the marks by the units they represent. Then decide how wide each bar should be. How much space will you allow between each bar?
In the graph above, each grid line going from left to right represents a multiple of 10. More gridlines can make it easier to be exact with the quantities being shown on the bar graph, but too many can make it confusing.
Step 4a: Draw the bars.
Mark where each bar starts and write the labels. Use your scale to determine the length of each bar. The formula for determining the length of each bar is as follows:
bar length in rectangles = number of units each bar represents ÷ units per rectangle
Step 4b: Now draw the bars on your graph. Check two bars with values that are close. Will their bars show a difference?
Each small rectangle in the graph below represents 10 units. So to draw a horizontal bar that represents 68 students, divide 68 by 10. Your quotient is a bar length of 6.8 rectangles. Thus the bar for Australia is 6.8 rectangles in length (and represents 68 students)
Step 5: Give the graph a title.
What is your graph about?

Example 2: The birth weight of several babies was recorded as shown in the table below. Construct a bar graph to visually display this data.
| Birth Weight of Babies | |
| Baby | Weight (lbs) |
| Charlie | 6.9 |
| Dennis | 8.1 |
| Joan | 7.9 |
| Lori | 6.2 |
| Matthew | 9.4 |
| Sarah | 10.5 |
Step 1: Find the range in values.
What units are used? What is the greatest value? What is the least value?
Step 2: Determine a scale.
Using graph paper, start with 1 box = 1 unit. What is the length (or height) of the longest bar? Will it fit? If not, change the scale and try again.
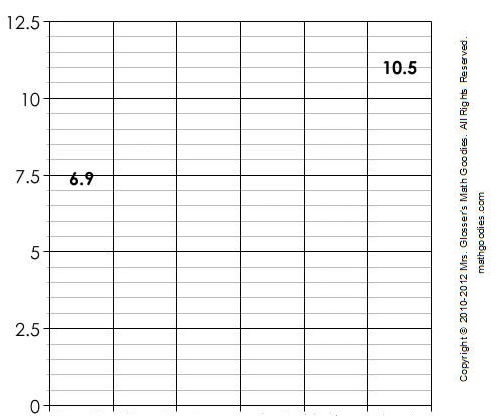
The scale must start at 0. So the vertical scale will range from 0 to 12.5.
Step 3: Label the graph.
Mark each rectangle along the scale. Label the marks by the units they represent. Then decide how wide each bar should be. How much space will you allow between each bar?
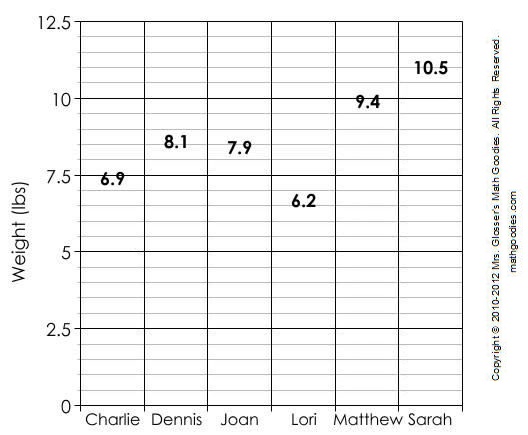
In the graph above, each grid line going from bottom to top represents a multiple of 0.5. More gridlines can make it easier to be exact with the quantities being shown on the bar graph, but too many can make it confusing.
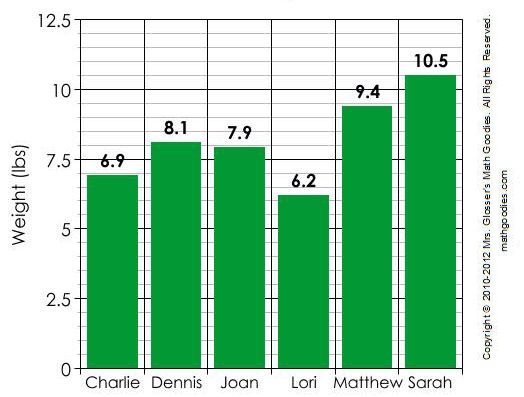
Step 4a: Draw the bars.
Mark where each bar starts and write the labels. Use your scale to determine the height of each bar. The formula for determining the height of each bar is as follows:
bar height in rectangles = number of units each bar represents ÷ units per rectangle
Step 4b: Now draw the bars on your graph. Check two bars with values that are close. Will their bars show a difference?
Each small rectangle in the graph below represents 0.5 units. So to draw a vertical bar that represents 6.9 lbs, divide 6.9 by 0.5. Your quotient is a bar height of 13.8 rectangles. Thus the bar for Charlie is 13.8 rectangles in height (and represents 6.9 lbs). To draw a bar that represents 10.5 lbs, divide 10.5 by 0.5. Your quotient is a bar height of 21 rectangles. Thus the bar for Sarah is 21 rectangles in height (and represents 10.5 lbs).
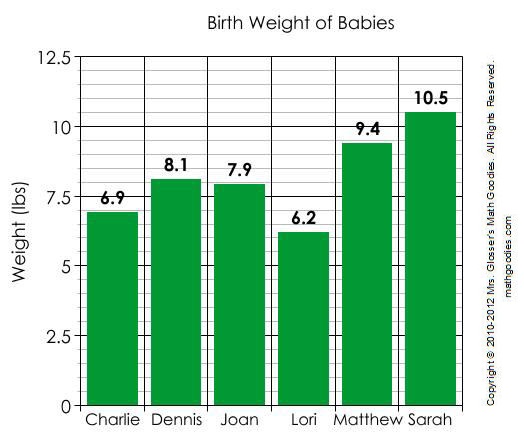
Step 5: Give the graph a title.
What is your graph about?
Summary: There are 5 steps for constructing a bar graph. These steps are listed below.
| Procedure for Constructing a Bar Graph | |
| Step 1: | Find the range in values. |
| Step 2: | Determine a scale. |
| Step 3: | Label the graph. |
| Step 4: | Draw the bars. |
| Step 5: | Give the graph a title. |
Exercises
Directions: Use the procedure above to construct a bar graph for each table in the exercises below. You may print and use our bar graph paper (PDF).
Exercise 1: The average heights of various trees in the USA were recorded in meters as shown in the table below. Construct a bar graph to visually display this data.
| Giant Trees in the USA | |
| Tree | Height in Meters |
| Acacia | 43 m |
| Bold Cypress | 42 m |
| American Birch | 49 m |
| Painted Buckeye | 44 m |
| Port-Oxford Cedar | 67 m |
| Coast Redwood | 110 m |
| Northeastern Oak | 55 m |
Solution: Answers will vary depending on the scales used and whether the bars are horizontal or vertical. Click here to see a sample horizontal bar graph for Exercise 1. Click here to see a sample vertical bar graph for Exercise 1.
Exercise 2: Six children were surveyed to find out what percent increase each received in his/her allowance as shown in the table below. Construct a bar graph to visually display this data.
| Increase in Allowance | |
| Child | Percent Increase |
| 1 | 12.4 |
| 2 | 13.3 |
| 3 | 12.7 |
| 4 | 12.1 |
| 5 | 13.1 |
| 6 | 12.5 |
Solution: Answers will vary depending on the scales used and whether the bars are horizontal or vertical. Click here to see a sample horizontal bar graph for Exercise 2. Click here to see a sample vertical bar graph for Exercise 2.

